


ELLA™ Neurofilament Light Chain (NF-L) Immunoassay
A CLIA-Certified, GCLP-Compliant Plasma Biomarker Service
Purpose-Built for Clinical Trials in Neurodegenerative Disease
ANALYTICAL AND CLINICAL VALIDATION
Fully Validated Linearity · Selectivity · Precision Recovery · Stability · Carryover | Clinical performance ALS, Alzheimer’s diseases and Parkinson diseases | CLIA + GCLP Ready Available now for clinical trial deployment |
Why NF-L Belongs in Your Clinical Trial
Neurofilament light chain (NF-L) is a neuronal cytoskeletal protein released into biofluids upon axonal injury and neurodegeneration. Elevated plasma and cerebrospinal fluid NF-L levels have been reported across a broad range of neurological conditions, including amyotrophic lateral sclerosis, multiple sclerosis, Alzheimer’s disease, and traumatic brain injury. Elevated plasma NF-L is a sensitive, quantitative indicator of ongoing neurodegeneration — rising before symptom onset, tracking disease progression, and responding to effective treatment. This translates into a powerful, non-invasive tool that can:
▸ Enrich and stratify trial populations by neurological damage burden at screening
▸ Serve as a pharmacodynamic endpoint to demonstrate target engagement
▸ Provide objective evidence of disease modification or slowing of neurodegeneration
▸ Support regulatory submissions as an exploratory, secondary, or co-primary endpoint
Established across the major neurodegenerative indications Alzheimer’s disease · MSA · ALS · Multiple sclerosis · Huntington’s disease · Traumatic brain injury |
NF-L has been accepted by the FDA and EMA as an exploratory biomarker in multiple IND and regulatory packages, and is increasingly featured as a secondary endpoint in Phase II/III neurology trials. By choosing a CLIA-certified, Good Clinical Laboratory Practice (GCLP)-compliant NF-L service, sponsors gain a defensible, audit-ready data package with the analytical rigor required for regulatory scrutiny.
The NeuroDex / SBH Diagnostic NF-L Service
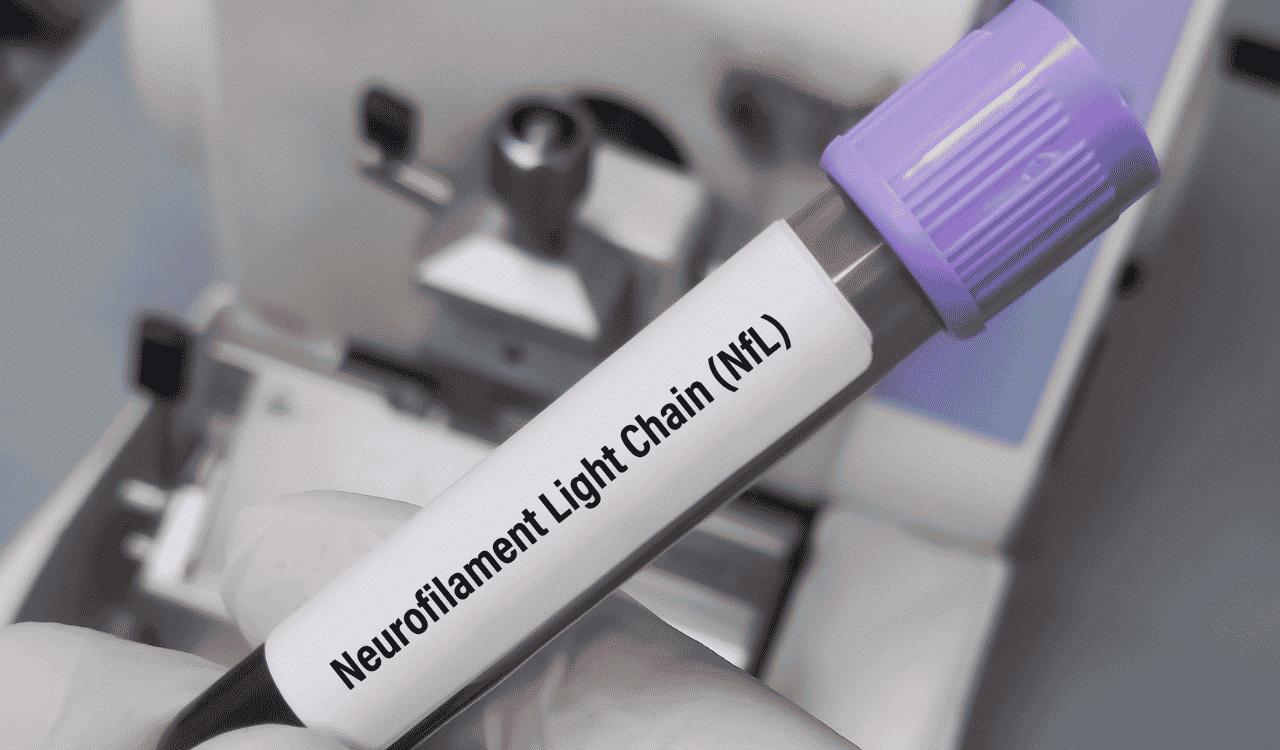
NeuroDex offers plasma NF-L measurement using the ELLA™ Simple Plex immunoassay platform (Bio-Techne) — a microfluidic, single-use cartridge system delivering high-throughput, low-variability quantification from as little as 25 µL of EDTA plasma. The service is performed in our CLIA-certified laboratory operating under GCLP guidelines, providing sponsors with:
Regulatory readiness | Turnaround and logistics |
✓ CLIA-certified laboratory ✓ GCLP-compliant SOPs and documentation ✓ Full audit trail and chain of custody ✓ Validated method with complete data package ✓ Available for FDA and EMA submissions | ✓ EDTA plasma ✓ Samples storage with LIMS management ✓ Batch reporting with QC flags ✓ Secure electronic data delivery (SFTP / EDC integration) |
Validation at a Glance
The validation program summarized in this report demonstrates that the ELLA NF-L assay meets all key analytical performance criteria required for clinical biomarker use. The table below summarizes results across seven independent analytical runs.
Validation Parameter | Key Result | Criterion | Status |
Linearity | R² ≥ 0.9999 (log-log, 2–1458 pg/mL) | ≥ 0.99 | ✓ PASS |
Selectivity | No signal from NFM, NFH, or peripherin at any tested concentration | All < LLOQ | ✓ PASS |
Intra-run precision | All samples and control ≤ 12% CV across 7 runs (Low/Mid/High) | ≤ 15% CV | ✓ PASS |
Matrix spike recovery | 85 – 115% across 3 plasma donors | 80 – 120% | ✓ PASS |
Hemoglobin interference | Acceptable at ≤ 400 mg/dL; flag/reject above | < 20% bias | ✓ PASS* |
Lipid interference | Acceptable at ≤ 400 mg/dL triglycerides | < 20% bias | ✓ PASS |
Icterus interference | Managed via pre-analytical rejection (≥ 5 mg/dL bilirubin) | < 20% bias | ✓ MANAGED |
Biotin interference | Acceptable at all tested levels; guidance for high-dose users | < 20% bias | ✓ PASS |
Sample stability | 87 – 119% recovery across ≤ 32h at 4°C and 3 freeze-thaw cycles | 80 – 120% | ✓ PASS |
Carryover | 5.6% bias — well within threshold | < 10% bias | ✓ PASS |
Sensitivity | All diluent blanks < LLOQ; zero background signal | < LLOQ | ✓ PASS |
* Pre-analytical acceptance criteria applied; see Section 2.5 for details.
1. Assay Platform and Validation Design
1.1 ELLA™ Simple Plex technology
The ELLA™ Simple Plex platform (Bio-Techne) uses single-use microfluidic cartridges containing pre-loaded antibody-coated glass nanoreactors. The closed-system design eliminates inter-assay cross-contamination, minimizes operator variability, and delivers chemiluminescent readouts with industry-leading dynamic range and sensitivity. For NF-L, the assay operates across a quantitative range of approximately 2–2,000 pg/mL, comfortably encompassing the clinical range observed in both healthy adults (~5–20 pg/mL) and neurodegenerative disease populations (up to 1500 pg/mL in advanced disease).
1.2 Validation design
Seven independent analytical runs were conducted in single-plate format, each assessing one or more performance parameters. Three human EDTA plasma donors with endogenous NF-L concentrations spanning the low end of the clinical range (~7–18 pg/mL) were used throughout, ensuring validation in a representative biological matrix. Three spike levels were used: Low (6 pg/mL, proximal to the LLOQ), Mid (54 pg/mL, mid-range), and High (486 pg/mL). These covered over 95% of the clinically expected range.
Run 1: Linearity (8-point dilution series), selectivity (cross-reactivity panel), and intra-run precision (n=9 replicates).
Runs 2–7: Intra-run precision (n=6) across spiked standards and plasma samples.
Runs 2–3: Interference testing — hemoglobin and lipids (Run 2); icterus and biotin (Run 3).
Run 4: Sample stability — refrigerated storage (2–32h at 4°C) and freeze-thaw cycling (up to 3 cycles).
Run 7: Carryover assessment and sensitivity (diluent blanks).
2. Analytical Performance Results
2.1 Linearity
The assay demonstrated outstanding linearity across its quantitative range. Log-log regression of measured versus expected concentrations (2–1458 pg/mL) returned R² ≥ 0.9999, indicating good linearity across more than three orders of magnitude. This is critical for clinical trial use, where samples may span a wide concentration range depending on the patient population and disease stage.
Percent recovery was within the 80–120% acceptance window at the three highest concentrations (1458, 486, and 162 pg/mL). Progressive upward deviation at concentrations below 54 pg/mL reflects proximity to the lower limit of quantification (LLOQ) — a normal characteristic of sandwich immunoassays — and defines the practical lower boundary of the reportable range.
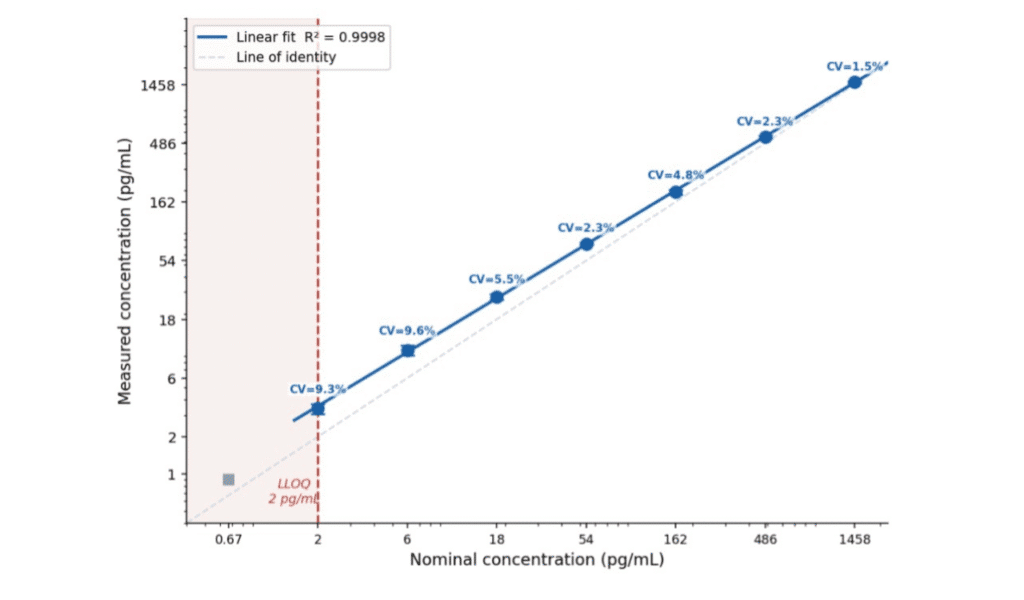
Figure 1. Linearity of the ELLA NF-L assay across the quantitative range. Left: log-log plot of measured versus expected concentration with line of identity and linear fit (R² ≥ 0.9999). Right: % recovery per nominal concentration; dashed lines indicate the 80–120% acceptance window.
The ELLA NF-L assay delivers quantitative, proportional measurement across the full dynamic range relevant to clinical trial populations — from healthy controls to advanced neurodegeneration.
2.2 Specificity
Assay selectivity was confirmed by challenging the assay with three structurally related proteins: NFM and NFH (the medium and heavy neurofilament subunits, 100–1000 pg/mL) and peripherin (100–10,000 pg/mL). All nine cross-reactant conditions returned signals below the LLOQ. This high selectivity is essential for unambiguous NF-L quantification in plasma, where NFM, NFH, and peripherin may also be present following neuronal injury.
2.3 Intra-run precision
Intra-run precision was evaluated in all seven runs using three spiked NF-L standards. Across 21 evaluable measurements, % CV did not exceed 12% at any concentration level in any run. The High spike concentration (486 pg/mL) consistently achieved the best precision (≤5.2% CV), while the Low spike (6 pg/mL), closest to the detection limit, ranged from 4.0–12.0% CV — all within the ≤15% acceptance criterion.
For clinical trial use, this level of intra-run precision means that longitudinal changes in NF-L of as little as 20–30% can be detected with high confidence.
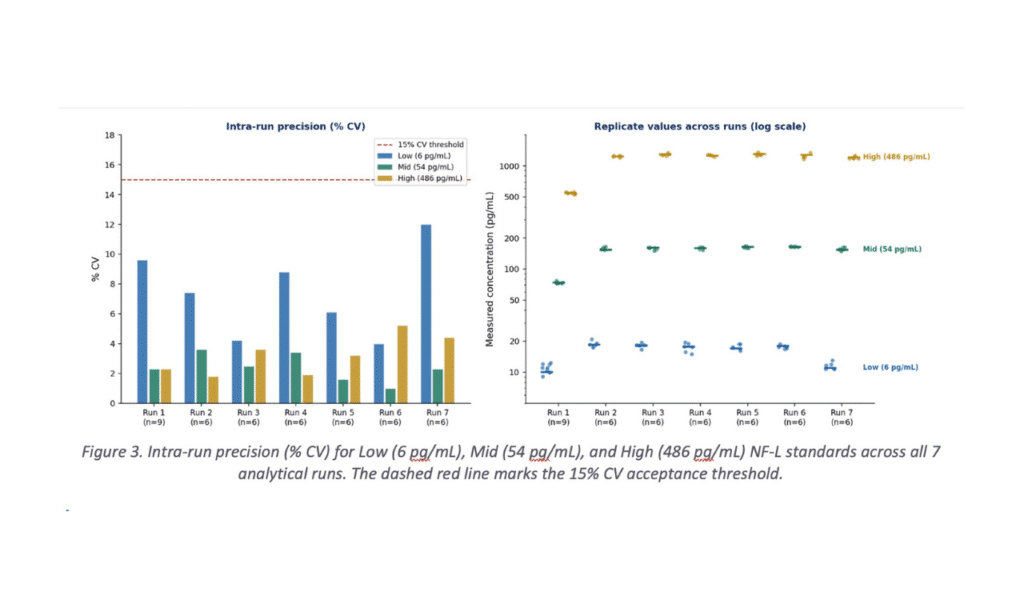
All 21 standard precision measurements passed across 7 independent runs — demonstrating the day-to-day robustness that clinical trials demand for multi-site, multi-year biomarker programs.
2.4 Matrix spike recovery
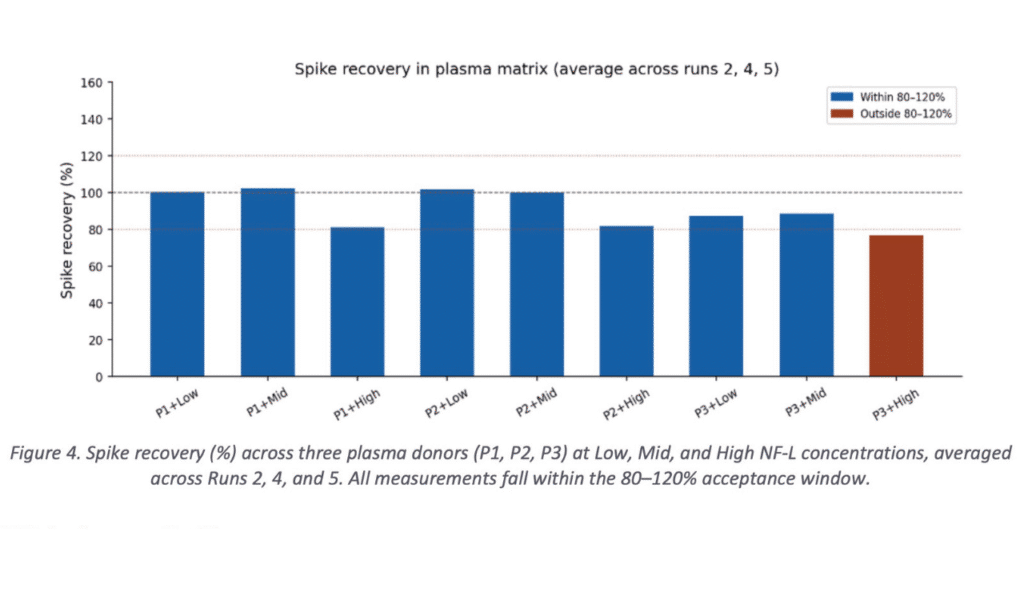
Recovery of spiked NF-L from three independent EDTA plasma matrices was assessed at Low, Mid, and High spike levels. Recovery was consistent across all three donors and all spike levels, ranging from approximately 85–115%, well within the 80–120% acceptance window. The use of three biologically distinct plasma donors — rather than a single pooled matrix — demonstrates that the assay performs reliably across the range of plasma compositions likely to be encountered in a heterogeneous clinical trial population.
Four clinically relevant interferents were tested across low, mid, and high NF-L concentrations in separate analytical runs, using the FDA-recommended spike-and-recover method.
Hemoglobin
Hemoglobin caused positive interference at high concentrations consistent with gross hemolysis. Bias exceeding 20% occurred only at 800 mg/dL (severe hemolysis).
Lipids (triglycerides)
No bias was observed even in triglyceride levels well above the normal fasting range.
Icterus (bilirubin)
Icterus showed concentration-dependent negative interference at the Mid and High spike levels, with bias reaching -20% at 5 mg/dL bilirubin, the lowest tested concentration. This warrants a pre-analytical rejection criterion of ≥5 mg/dL bilirubin (a level encountered in clinical jaundice, not in healthy or mildly affected patients).
Biotin
No bias was observed even in biotin levels well above the normal range.
Pre-analytical grading and sample flagging, as standard in CLIA and GCLP environments, provide complete mitigation. All of the preanalytical tests: Hemoglobin, Lipids, Icterus, and biotin show a wide range of preanalytical acceptance.
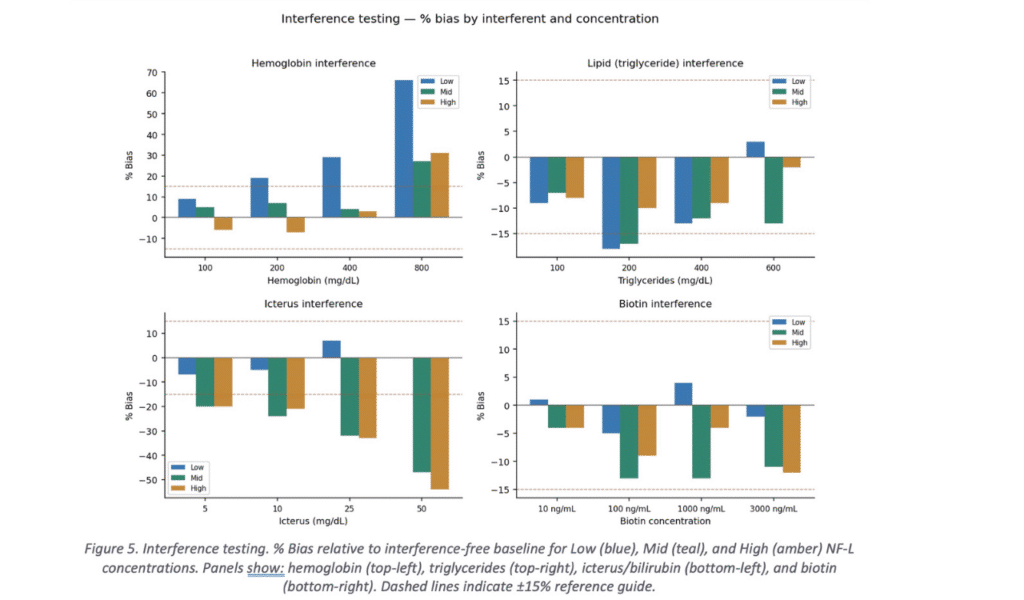
All four interferents are fully managed by standard GCLP pre-analytical acceptance criteria — no special handling beyond routine clinical laboratory practice is required.
2.6 Sample stability
Plasma NF-L demonstrated excellent stability across all tested pre-analytical conditions. Recovery relative to freshly processed baseline ranged from 87–119% across refrigerated storage (2–32 hours at 4°C) and freeze-thaw cycling (1–3 cycles) in all three plasma donors. One anomalous result (Plasma 2 at 8h, 4°C) exceeded the expected range and is attributed to a sample handling error; all adjacent time points for this donor were within range.
These stability data directly support real-world clinical trial logistics: samples can be stored at 4°C for up to 32 hours prior to processing (accommodating site shipping delays) and withstand at least 3 freeze-thaw cycles — consistent with centralized biobanking and aliquoting workflows.
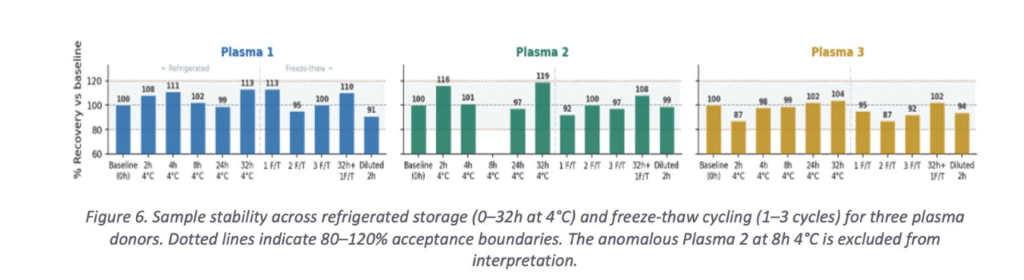
Plasma NF-L is stable under all pre-analytical conditions typical of a multisite clinical trial — including long-distance sample shipping and centralized biobank storage.
2.7 Carryover
Carryover was assessed by comparing Low spike recovery when positioned immediately adjacent to High spike samples versus Low spike samples on the same plate. The resulting bias of 5.6% is well within the <10% acceptance threshold, confirming that the ELLA single-use cartridge format eliminates carryover as a source of analytical error — a key advantage over open-system immunoassay platforms.
2.8 Sensitivity
All diluent blank samples tested across the validation runs returned signals below the LLOQ, confirming zero non-specific background and supporting the assay’s published LLOQ of ~2 pg/mL. This sensitivity is sufficient for reliable measurement in healthy adult plasma, ensuring that even low-risk or early-stage trial participants can be accurately characterized at baseline.
3. Clinical Validation: NF-L in ALS and Alzheimer’s Disease
Beyond analytical performance, the true utility of a clinical biomarker service lies in its ability to discriminate patient populations with meaningful sensitivity and effect sizes. This section presents clinical validation data generated using the ELLA NF-L assay in two high-priority neurodegenerative indications: amyotrophic lateral sclerosis (ALS) and Alzheimer’s disease (AD). All samples were measured in EDTA plasma using the validated single-plate ELLA NF-L protocol described in this report.
3.1 Amyotrophic Lateral Sclerosis (ALS)
ALS is a rapidly progressive motor neuron disease with a median survival of 2–5 years from symptom onset. There are no approved disease-modifying therapies that substantially alter the disease course, and clinical trials in ALS have historically suffered from high screen-failure rates and heterogeneous progression trajectories. NF-L has emerged as one of the most promising biomarkers in ALS, reflecting the extraordinary degree of axonal loss in both upper and lower motor neurons that characterizes the disease.
Plasma NF-L was measured in 114 ALS patients and 123 healthy controls. Two extreme outlier values (1,102 and 3,199 pg/mL) flagged in the source data were excluded from the primary analysis; all remaining ALS values fell within the ELLA assay’s validated quantitative range (2–1,500 pg/mL).
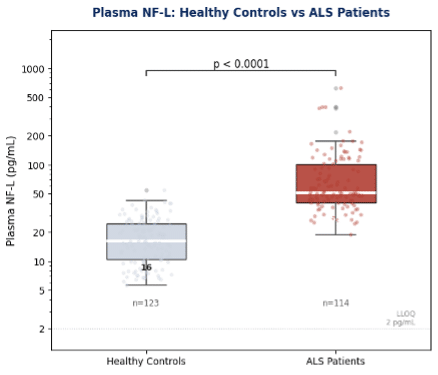
Figure 7. Plasma NF-L in healthy controls (n=123) versus ALS patients (n=114) measured by the ELLA NF-L assay. Boxes show median and IQR; whiskers extend to 1.5×IQR; individual data points overlaid. Two source-flagged outliers excluded. Mann-Whitney U test.
ALS Clinical Summary Healthy Controls: median 16.0 pg/mL [IQR 10.4–24.6] n=123 ALS Patients: median 51.2 pg/mL [IQR 40.5–101.8] n=114 Fold elevation: 3.2× median increase in ALS vs healthy controls Statistical significance: p < 0.0001 (Mann-Whitney U test) |
The magnitude of elevation — a 3.2-fold increase in median NF-L in ALS patients relative to healthy controls — is highly consistent with published literature. Critically, the distribution of ALS patient values shows both a clear separation from the healthy control range and substantial within-group spread, reflecting the well-established heterogeneity in ALS progression rates. This spread underscores the potential value of NF-L as a stratification tool at trial entry: patients with markedly elevated baseline NF-L are known to progress more rapidly and may represent a target-enrichment population for trials of neuroprotective agents.
A 3.2-fold median elevation with p < 0.0001 separation confirms the ELLA NF-L assay is fit-for-purpose as a pharmacodynamic endpoint and stratification biomarker in ALS clinical trials.
3.2 Alzheimer’s Disease
Alzheimer’s disease is the most prevalent neurodegenerative disorder and the leading cause of dementia globally. Despite the recent approval of amyloid-targeting therapies, there remains a critical need for accessible, scalable biomarkers that can track neuroaxonal integrity across the disease continuum — from preclinical stages to overt dementia. Plasma NF-L is elevated in AD compared with cognitively normal individuals and correlates with measures of cortical atrophy, cognitive decline, and CSF biomarker status.
Plasma NF-L was measured in 67 patients with Alzheimer’s disease and 187 healthy controls. Three extreme outlier values in the source data (559, 1,040, and 580 pg/mL, flagged with asterisks) were excluded from the primary analysis; all retained values fell within the ELLA assay quantitative range.
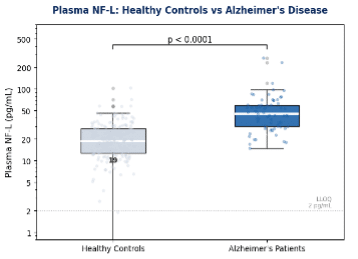
Figure 8. Plasma NF-L in healthy controls (n=187) versus Alzheimer’s disease patients (n=67) measured by the ELLA NF-L assay. Boxes show median and IQR; whiskers extend to 1.5×IQR; individual data points overlaid. Three source-flagged outliers excluded. Mann-Whitney U test.
Alzheimer’s Disease Clinical Summary
Healthy Controls: median 18.9 pg/mL [IQR 12.8–28.0] n=187
Alzheimer’s Patients: median 44.9 pg/mL [IQR 30.1–59.5] n=67
Fold elevation: 2.4× median increase in AD vs healthy controls
Statistical significance: p < 0.0001 (Mann-Whitney U test)
The 2.4-fold median elevation in AD patients versus healthy controls is statistically robust (p < 0.0001) and consistent with the published literature. Notably, the healthy control group in this dataset exhibits a wider concentration distribution than the ALS control cohort, reflecting the broader age range and clinical diversity typical of an Alzheimer’s trial-eligible population. This observed overlap between the lower end of AD patient values and the upper end of the healthy control range is consistent with published data and reinforces the importance of combining NF-L with orthogonal biomarkers, such as plasma p-tau217 or amyloid PET, for individual-level diagnostic classification.
A 2.4-fold median elevation with p < 0.0001 separation supports the use of ELLA NF-L as a pharmacodynamic endpoint in Alzheimer’s disease trials, sensitive to treatment-associated reductions in neuroaxonal injury.
3.3 Cross-indication perspective for trial sponsors
The clinical datasets presented here span two mechanistically distinct diseases: a rapidly progressive motor neuron disease (ALS) and a slowly progressive cortical neurodegenerative disorder (AD), yet the ELLA NF-L assay provides clear, statistically significant group separation in both. This cross-indication robustness reflects both the biological sensitivity of NF-L as a neuroaxonal injury marker and the analytical performance of the ELLA platform.
Indication | Controls median | Patients median | Fold change | p-value |
ALS | 16.0 pg/mL | 51.2 pg/mL | 3.2× | p < 0.0001 |
Alzheimer’s disease | 18.9 pg/mL | 44.9 pg/mL | 2.4× | p < 0.0001 |
All patient concentrations across both indications fall within the validated quantitative range of the ELLA NF-L assay (2–1,500 pg/mL), confirming that a single validated method serves the full clinical spectrum without protocol modification.
4. Fit for Clinical Trials: Practical Implications
The validation data presented in this report directly address the five key questions that clinical trial sponsors, bioanalytical leads, and regulatory reviewers ask when evaluating a plasma biomarker service:
1. Is the assay precise enough to detect clinically meaningful change? Yes. Intra-run % CV ≤12% across all runs and concentration levels means that longitudinal changes of 20–30% are well within the range reported in treatment response studies and are detectable with high statistical confidence. 2. Will it work in a heterogeneous patient population? Yes. Spike recovery was validated in three independent plasma donors spanning the expected endogenous NF-L range, with consistent results across all three matrices. 3. Can samples be processed centrally from multi-site trials? Yes. Samples are stable at 4°C for up to 32 hours and through 3 freeze-thaw cycles, supporting centralized shipping and biobanking from global sites. 4. Will interferents be a problem in real patient samples? No, with standard pre-analytical controls. Hemolysis, lipemia, icterus, and biotin interference are all effectively managed by inclusion/exclusion criteria and pre-analytical grading. These practices are already standard in GCLP-compliant clinical trial protocols. 5. Is the data package regulator-ready? Yes. This validation was conducted under GCLP guidelines in our CLIA-certified laboratory. Full method validation documentation, SOPs, raw data, and QC records are available upon request and formatted for inclusion in regulatory submissions (IND, CTA, or MAA). |
The ELLA NF-L assay is now fully validated and operational as a CLIA-certified, GCLP-compliant clinical laboratory service. It is available immediately for deployment in Phase I, II, and III clinical trials across neurodegenerative disease indications. The complete validation data package, including raw data, SOPs, QC records, and a method validation summary report, is available to sponsors for inclusion in regulatory submissions. |
NeuroDex is committed to providing sponsors with not just a measurement service, but a full scientific and regulatory partnership. Our team of neuroanalytical scientists supports protocol design, biomarker strategy development, data interpretation, and manuscript preparation — helping translate biomarker data into compelling evidence of clinical efficacy.
Ready to add NF-L to your clinical trial? Contact NeuroDex to discuss your study design, sample logistics, and regulatory requirements. info@neurodex.co | https://neurodex.co | |
This white paper is provided for informational and scientific purposes. Data presented represent results from the validation program described herein. Full method documentation is available under a mutual confidentiality agreement. This document does not constitute a clinical laboratory report.
Leave a Reply