


Interpreting Blood-Based CNS Biomarkers: 4 Questions for Trial Teams
Blood-based CNS biomarkers are now standard in neurodegeneration trials. Blood-based biomarkers in general sit at the center of most clinical trial biomarker strategies. Blood costs less than CSF, it can be collected at every visit, and it is the most practical lumbar puncture alternative for programs that need frequent sampling. But a plasma concentration is a composite. The central nervous system contributes only part of it. Peripheral tissues, blood cells, renal clearance and sample handling contribute the rest. When a blood-based CNS biomarker moves between visits or differs between treatment arms, the number alone does not tell you whether anything changed in the brain.
That gap matters most where trial decisions depend on the result: patient stratification, pharmacodynamic monitoring in neurodegeneration, and go/no-go calls built on CNS target engagement measured in blood. The four questions below apply to any blood biomarker result, whether NfL, p-tau, GFAP, α-synuclein or TDP-43, and to any assay format.
How should you interpret a blood biomarker result in a neurodegeneration trial?
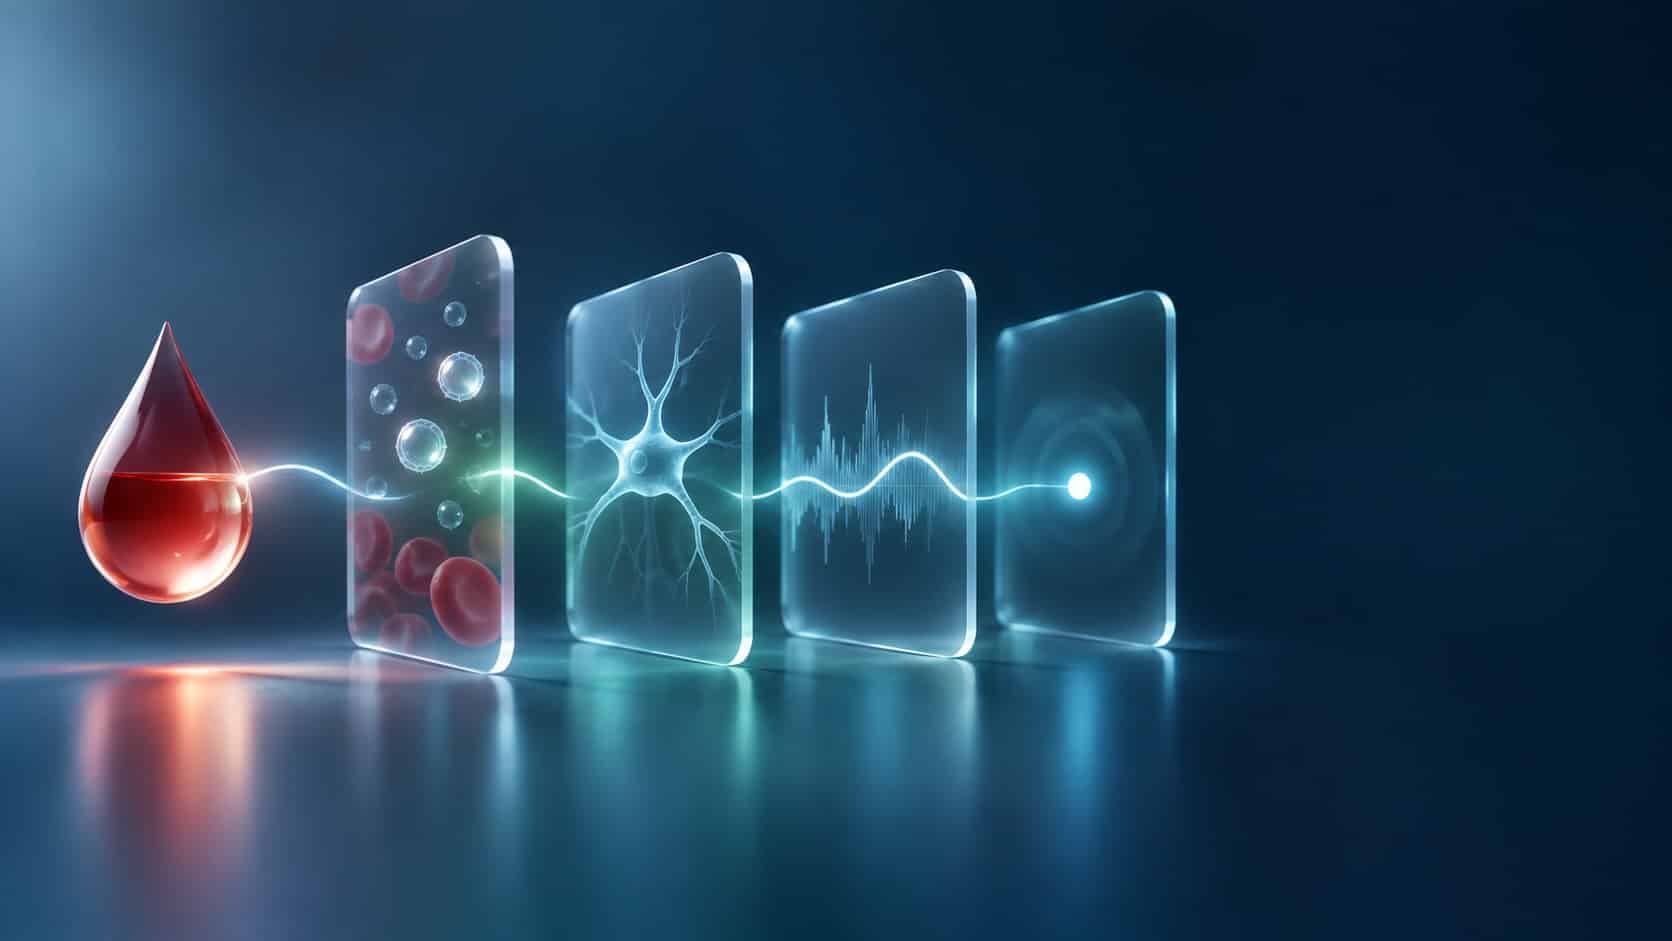
Before acting on a blood biomarker result, answer four questions:
- Source: Where did the signal come from, the CNS or peripheral tissue?
- Biology: What process does it report, disease-specific pathology or general injury?
- Noise: Is the change larger than analytical and biological variation?
- Use: What trial decision is the result qualified to support?
1. Where did the signal come from?
Most proteins measured as CNS biomarkers are not exclusive to the CNS. Plasma levels reflect every tissue that releases the protein, weighted by how much each tissue produces and how quickly the protein is cleared.
α-Synuclein is the clearest example. More than 99% of α-synuclein in blood is held inside red blood cells. Plasma, platelets and mononuclear cells together account for less than 1% [1]. Any hemolysis during collection or processing adds red-cell α-synuclein to the measurement, and that contribution can exceed the neuronal signal a Parkinson’s disease blood biomarker is meant to capture. This is one reason an alpha-synuclein plasma assay has been difficult to make consistent across cohorts.
NfL has a different problem. Damaged axons release it in both the central and the peripheral nervous system. In patients with Charcot-Marie-Tooth disease, an inherited peripheral neuropathy, plasma NfL was significantly higher than in age-matched controls (median 26.0 vs 14.6 pg/mL) and tracked neuropathy severity [2]. In an older trial population, a rising plasma NfL can reflect peripheral nerve damage as easily as neurodegeneration. This is a large part of what sits behind plasma NfL variability in stratification models.
What to ask: What fraction of this signal is plausibly CNS-derived, and what has been done to reduce peripheral contributions?
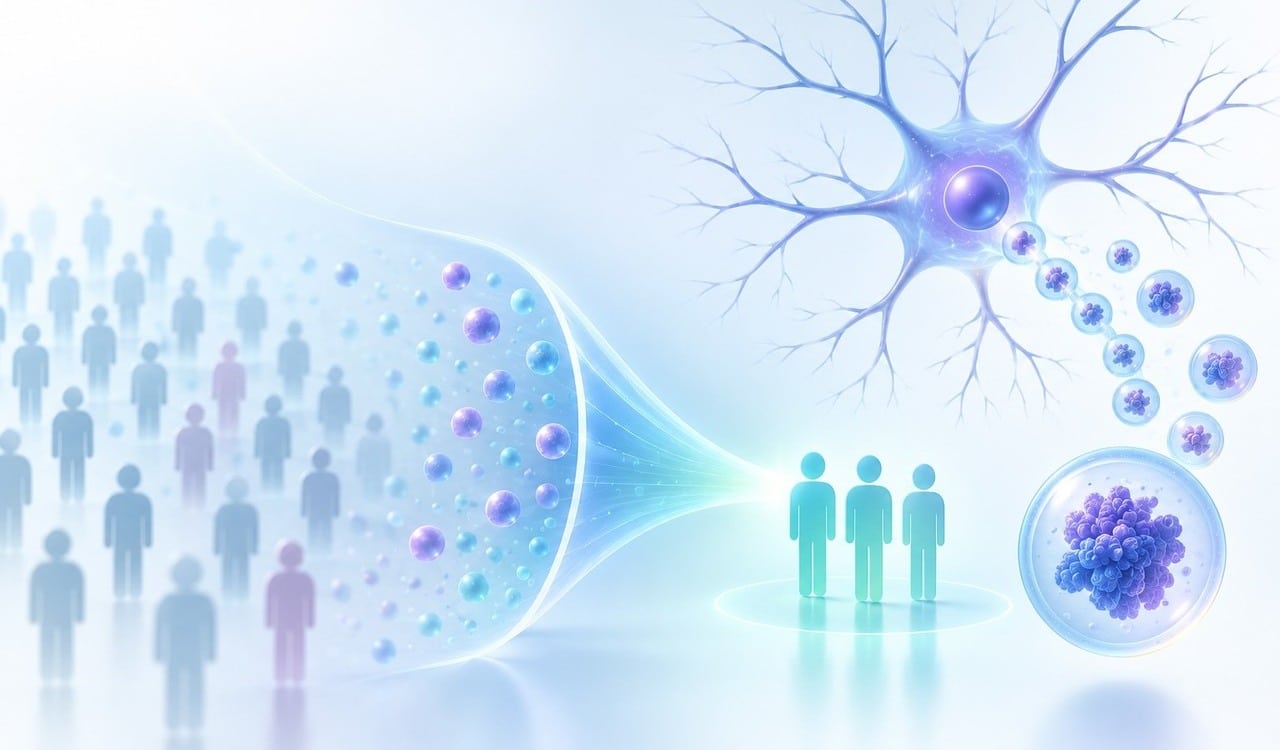
One answer is to change the sample before measuring it. Neurons release extracellular vesicles, and a fraction of them reach peripheral blood carrying neuronal proteins. Enriching for neuron-derived extracellular vesicles (NDEVs) shifts the measured fraction toward CNS origin, and isolation platforms such as ExoSORT™ are built for that step. Enrichment does not remove every peripheral contribution, so the source question still needs data to answer it: origin markers, depletion controls, and comparison against CSF where paired samples exist.
2. What process is it actually reporting?
Knowing that a signal comes from neurons does not tell you what it means. Blood biomarkers in neurodegeneration fall broadly into two groups.
Markers of general injury, mainly NfL and GFAP, rise when neurons or astrocytes are damaged, whatever the cause. They are useful for measuring disease intensity, for tracking neuroinflammation, and in some settings for prognosis. They cannot tell you which pathology is driving the damage. On their own, they cannot select patients for a therapy aimed at one protein, or show that the therapy engaged its target.
Markers of specific pathology aim to report the protein a program is designed to change: a phosphorylated tau species, aggregated α-synuclein, mislocalized TDP-43. Here the main challenge is often access rather than specificity. Plasma p-tau specificity has improved enough to make it a working tool in Alzheimer’s disease. TDP-43 pathology, by contrast, develops inside neurons, and measuring an intracellular process from free plasma protein is indirect at best. That is why a TDP-43 blood test has long been considered out of reach for ALS and FTD trials.
Vesicle cargo offers a more direct route. In a 2024 study, TDP-43 measured in plasma extracellular vesicles was elevated in ALS and in behavioral-variant FTD with TDP-43 pathology. The ratio of 3R to 4R tau isoforms in the same vesicles separated tau pathology from TDP-43 pathology. Both markers distinguished diagnostic groups with AUCs above 0.9, correlated with disease severity, and replicated in an independent validation cohort of 292 patients [3]. This is the kind of evidence that moves an EV-based TDP-43 biomarker from a diagnostic signal toward a stratification and target-engagement tool.
What to ask: Does this marker report the biology our intervention is designed to change, or downstream damage that many processes can produce?
3. Is the change larger than the noise?
A biomarker that is CNS-derived and pathology-specific can still mislead if the change you see falls within the range the marker moves on its own. Three sources of noise each need separate attention.
Comorbidities. In a population-based cohort, chronic kidney disease was associated with higher plasma p-tau181 and p-tau217. The difference between people with and without CKD was similar in size to the difference between amyloid-positive and amyloid-negative participants [4]. Blood NfL behaves the same way. It correlated with serum creatinine in healthy older adults (r = 0.50) and in people with diabetes (r = 0.56), and the association held after adjusting for age, sex and body mass index [5]. In a trial population, renal function, metabolic disease and body size can shift baseline values enough to blur stratification cut-offs.
Biological variation. Plasma biomarker levels fluctuate from week to week, even in healthy people. Biological variation studies quantify this as within-subject variation and convert it into a reference change value (RCV): the smallest change between two measurements in the same person that exceeds combined analytical and biological variation. In 20 healthy adults aged 40 to 60, sampled weekly for 10 weeks, within-subject variation ranged from about 3% for the Aβ42/Aβ40 ratio to about 16% for p-tau181. For most markers, an individual increase had to reach roughly 25–40% before it could be called a real change [6]. Small within-person shifts, the kind often reported as early pharmacodynamic signals, can sit inside that window.
Pre-analytical handling. Collection tube, time to processing, centrifugation, freeze–thaw cycles and hemolysis all affect plasma measurements. EV-based assays add isolation and characterization steps on top. Reporting these variables in line with MISEV2023, the field’s minimal-information guidelines for extracellular vesicle studies, makes results comparable across sites and studies [7].
What to ask: What is the assay’s precision, what is the marker’s known biological variation, and is the observed change larger than both combined? Which comorbidities were measured and adjusted for?
4. What decision does this result support?
Even a clean, CNS-specific, above-noise result has limits on what it can justify. The FDA-NIH BEST Resource defines biomarker categories by intended use: susceptibility/risk, diagnostic, monitoring, prognostic, predictive, pharmacodynamic/response and safety [8]. Evidence that supports a marker for one use does not automatically carry over to another.
In practice the distinction is easy to lose. A marker that separates patients from controls at group level (diagnostic) may not track change within one patient over 12 months (monitoring). A marker that predicts faster decline (prognostic) does not tell you who will respond to treatment (predictive). A marker that shifts with treatment (pharmacodynamic/response) has not, by that fact alone, shown that the shift brings clinical benefit. When a blood biomarker is asked to support a decision its evidence does not cover, patient stratification and go/no-go calls inherit that gap.
What to ask: What context of use is this marker validated for, in which population, and does our planned decision fall inside it?
The four questions at a glance
| Question | What can go wrong | What to ask your assay provider |
|---|---|---|
| Where did the signal come from? | Peripheral tissue or blood cells dominate the measurement | What evidence shows the signal is CNS-derived? |
| What process is it reporting? | General injury is read as target-specific pathology | Does the marker reflect the pathology our program targets? |
| Is the change larger than the noise? | Comorbidities, biological variation or handling explain the change | What are the assay CV, the within-subject variation and the known confounders? |
| What decision does it support? | A marker validated for one use is applied to another | What context of use and population is the evidence for? |
Reading blood biomarker results with confidence
Blood-based CNS biomarkers can reduce a trial’s dependence on lumbar puncture, but only when each result is read with its source, its biology, its noise and its context of use in view. At NeuroDex, our work on neuron-derived extracellular vesicles focuses on the first two questions, getting closer to the neuronal signal and the pathology inside it, while building the variability and validation data the last two require. If you are planning a biomarker strategy for an ALS, Parkinson’s, Alzheimer’s or FTD program, we’re happy to set up a call if it’s worth a closer look.
References
- Barbour R, et al. Red blood cells are the major source of alpha-synuclein in blood. Neurodegener Dis. 2008;5(2):55–59. https://doi.org/10.1159/000112832
- Sandelius Å, Zetterberg H, Blennow K, et al. Plasma neurofilament light chain concentration in the inherited peripheral neuropathies. Neurology. 2018;90. https://doi.org/10.1212/WNL.0000000000004932
- Chatterjee M, Özdemir S, Fritz C, et al. Plasma extracellular vesicle tau and TDP-43 as diagnostic biomarkers in FTD and ALS. Nat Med. 2024;30(6):1771–1783. https://doi.org/10.1038/s41591-024-02937-4
- Mielke MM, Dage JL, Frank RD, et al. Performance of plasma phosphorylated tau 181 and 217 in the community. Nat Med. 2022;28(7):1398–1405. https://doi.org/10.1038/s41591-022-01822-2
- Akamine S, Marutani N, Kanayama D, et al. Renal function is associated with blood neurofilament light chain level in older adults. Sci Rep. 2020;10:20350. https://doi.org/10.1038/s41598-020-76990-7
- Brum WS, Ashton NJ, Simrén J, et al. Biological variation estimates of Alzheimer’s disease plasma biomarkers in healthy individuals. Alzheimers Dement. 2024;20(2):1284–1297. https://doi.org/10.1002/alz.13518
- Welsh JA, et al. Minimal information for studies of extracellular vesicles (MISEV2023): From basic to advanced approaches. J Extracell Vesicles. 2024;13(2):e12404. https://doi.org/10.1002/jev2.12404
- FDA-NIH Biomarker Working Group. BEST (Biomarkers, EndpointS, and other Tools) Resource. Silver Spring (MD): Food and Drug Administration; Bethesda (MD): National Institutes of Health. https://www.ncbi.nlm.nih.gov/books/NBK326791/
More in Regulatory & trial design
- How Blood-Based CNS Biomarkers Improve Trial Endpoints
- How Do You Add a Brain-Specific Biomarker to a Trial Panel?
- More Draws, Better Decisions: Blood Biomarker Variability in Longitudinal Trial Design
- Before You Add a Blood Biomarker to Your Trial, Test It on Samples You Already Have
Working with NeuroDex
NeuroDex measures brain-derived biomarkers from a routine blood draw for pharma and biotech teams running CNS studies.